Real-Time Data Dashboards: A Practical Guide for Owners

If you're running a business without a clear, live view of your sales, operations, or customer activity, you're likely making decisions based on gut feeling or outdated spreadsheets. A real-time data dashboard solves this by pulling information from your systems — sales platforms, inventory, website traffic, customer support tools — and displaying it in one place, updated as events happen. Instead of waiting for a weekly report, you see what's happening right now, and you can act on it immediately.
Key Takeaways
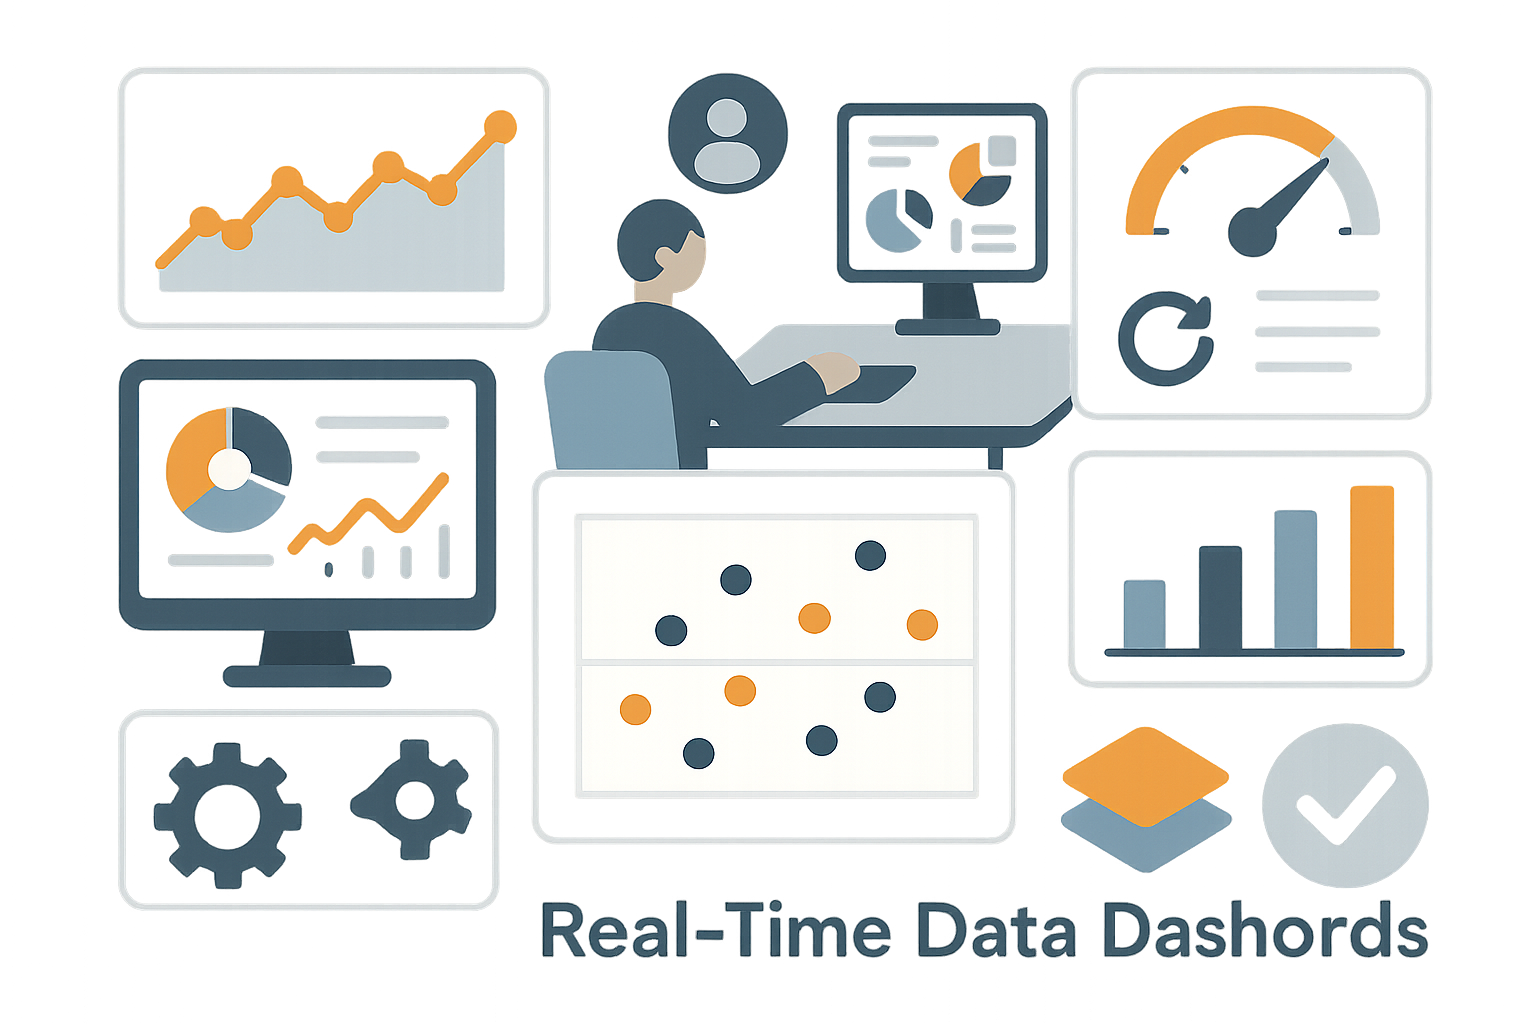
- Real-time dashboards combine live data from multiple sources into one visual, decision-ready screen.
- They differ from static reports because they update continuously, not on a fixed schedule.
- Custom-built dashboards fit your exact data sources and business logic, unlike generic off-the-shelf widgets.
- A well-planned dashboard project starts with clear questions you need answered, not with the technology.
- Ongoing maintenance and data quality matter as much as the initial build.
What a Real-Time Data Dashboard Actually Does
A dashboard is only as useful as the data feeding it and the questions it's designed to answer. At its core, a real-time dashboard performs three jobs: it collects data continuously from your source systems, processes and organizes that data into meaningful metrics, and presents it visually so a non-technical person can understand it at a glance.
How It Differs from a Standard Report
A monthly sales report tells you what happened last month. A real-time dashboard tells you what is happening right now — how many orders came in during the last hour, which product is trending today, or whether your server response times are slowing down mid-shift. The difference matters most in situations where speed of reaction affects revenue or customer experience: e-commerce flash sales, support ticket queues, delivery logistics, or manufacturing lines.
Static reports are built by exporting data and formatting it after the fact. Real-time dashboards are built on live connections — through APIs, webhooks, or direct database queries — so the numbers on screen reflect the current state of your business, not last week's snapshot. This concept is closely related to what's known in the industry as real-time computing, where systems are designed to process and respond to data within a guaranteed short time frame.
Common Data Sources Business Owners Want Connected
Most owners who ask for a dashboard are trying to unify a handful of tools they already use. Typical sources include:
- Payment and sales platforms (Stripe, Shopify, custom checkout systems)
- CRM and customer support software
- Website and app analytics
- Inventory and warehouse management systems
- Internal databases holding operational or financial records
The value isn't in any single data source — it's in seeing them together. A dashboard that shows website traffic next to conversion rate next to current stock levels lets you spot a problem (a spike in traffic with no corresponding sales) far faster than checking three separate tools.
Why Off-the-Shelf Dashboard Tools Often Fall Short
There are many pre-built analytics platforms on the market, and they work well for generic, high-volume needs like standard e-commerce metrics or team task tracking. But most growing businesses eventually hit a wall with them for a few predictable reasons.
Your Business Logic Isn't Generic
Off-the-shelf tools are built to serve thousands of different companies with one flexible template. That means the metrics they emphasize, the way they calculate "conversion" or "churn," and the way data is grouped rarely match exactly how you run your business. You end up adjusting your reporting habits to fit the tool, instead of the tool reflecting how you actually operate.
A custom-built dashboard is designed around your specific business rules — how you define a qualified lead, how your margins are calculated, which stages your fulfillment process actually has. When the logic matches your business instead of a generic template, the numbers become trustworthy enough to act on without a second round of manual verification.
Data Silos and Integration Gaps
Many businesses run five or six different tools that were never designed to talk to each other. Generic dashboard products usually support the most popular integrations but struggle — or charge extra — when you need to pull from a legacy system, an internal database, or a niche industry tool. This is where custom development matters most: connecting to whatever systems you actually use, including older software that wasn't built with modern APIs in mind, rather than limiting you to a pre-approved integration list.
Ownership and Long-Term Cost
Subscription-based analytics tools scale their pricing with usage, data volume, or number of seats. Over several years, that recurring cost can exceed what a one-time custom build would have cost, especially once you factor in the productivity lost to workarounds for missing features. With a custom dashboard, you own the system outright — the data model, the visual layer, and the underlying logic — and you're not tied to a vendor's roadmap or pricing changes.
How a Custom Dashboard Project Actually Gets Built
Understanding the build process helps you evaluate whether a project is being planned properly, whether you're doing it in-house or working with a development team.
Step 1: Defining the Questions, Not the Charts
The most common mistake in dashboard projects is starting with "what should the screen look like" instead of "what decisions does this need to support." A useful first step is listing the five or six questions you check most often — daily revenue, current inventory shortfalls, open support tickets past a certain age, ad spend versus return. Every chart and number on the dashboard should trace back to one of these real questions. This is one of the reasons a senior team that has built full systems end-to-end, rather than just front-end visuals, tends to produce dashboards that hold up over time — the data model is designed with the business logic in mind from day one, not bolted on afterward.
Step 2: Connecting and Structuring the Data
Once the target questions are clear, the next step is building the data pipeline: connecting to source systems, cleaning and structuring the incoming data, and deciding how "real-time" it truly needs to be. Not every metric needs to update every second — some genuinely need instant updates (like live order counts), while others are perfectly useful updated every few minutes (like weekly trend comparisons). Being deliberate about this saves on infrastructure cost and keeps the system simpler to maintain.
Step 3: Designing for the People Who Will Actually Look at It
A dashboard used by a store owner checking numbers on a phone between customers needs a very different layout than one used by an operations manager monitoring a wall-mounted screen. Good dashboard design accounts for who's looking, how often, and on what device, and avoids the common trap of cramming every possible metric onto one screen. Fewer, well-chosen numbers that are always accurate beat a crowded dashboard that looks impressive but gets ignored after the first week.
Step 4: Testing, Launch, and Ongoing Accuracy
Before launch, every number on the dashboard should be checked against the source system manually — this is where subtle bugs in data logic get caught. After launch, data sources change: a CRM field gets renamed, a new sales channel gets added, an API updates its structure. A dashboard that isn't maintained will quietly drift out of accuracy over time, which is why ongoing support is as important as the initial build. This mirrors broader principles in business intelligence practice, where data governance and maintenance are treated as continuous responsibilities, not one-time tasks.
Because these projects touch web systems, backend data infrastructure, and increasingly AI-driven pattern detection (like flagging unusual spikes or predicting stock shortages before they happen), having one team handle the whole build — rather than piecing together a front-end freelancer, a backend developer, and a separate integrations specialist — tends to produce a more coherent, reliable result. That end-to-end approach, covering web, mobile, and AI systems under one senior team, is exactly the kind of setup that avoids the miscommunication and inconsistent data logic that often happens when a dashboard is assembled from disconnected pieces.
Frequently Asked Questions
How "real-time" does a dashboard actually need to be?
It depends on the decision the dashboard supports. Order tracking or server monitoring often needs updates within seconds. Sales trends, marketing performance, or inventory forecasting are usually fine updating every few minutes. Being specific about this during planning keeps the system simpler and less expensive to run.
Can a dashboard connect to the tools I already use?
In most cases, yes — through APIs, database connections, or webhooks, depending on what each tool supports. Older or niche systems sometimes need custom integration work rather than a plug-and-play connector, which is a common reason businesses move from generic tools to a custom build.
Do I need a website already to have a dashboard built?
No. A dashboard is a separate system that reads from your existing data sources — it doesn't require a public website. It can sit behind a private login and be built alongside or independently of any web or mobile presence you're planning.
What happens after the dashboard is launched?
Source systems change over time, so dashboards need periodic checks to make sure the data connections and calculations stay accurate. Treating this as an ongoing part of the system, rather than a one-time delivery, is what keeps a dashboard trustworthy months or years after launch.